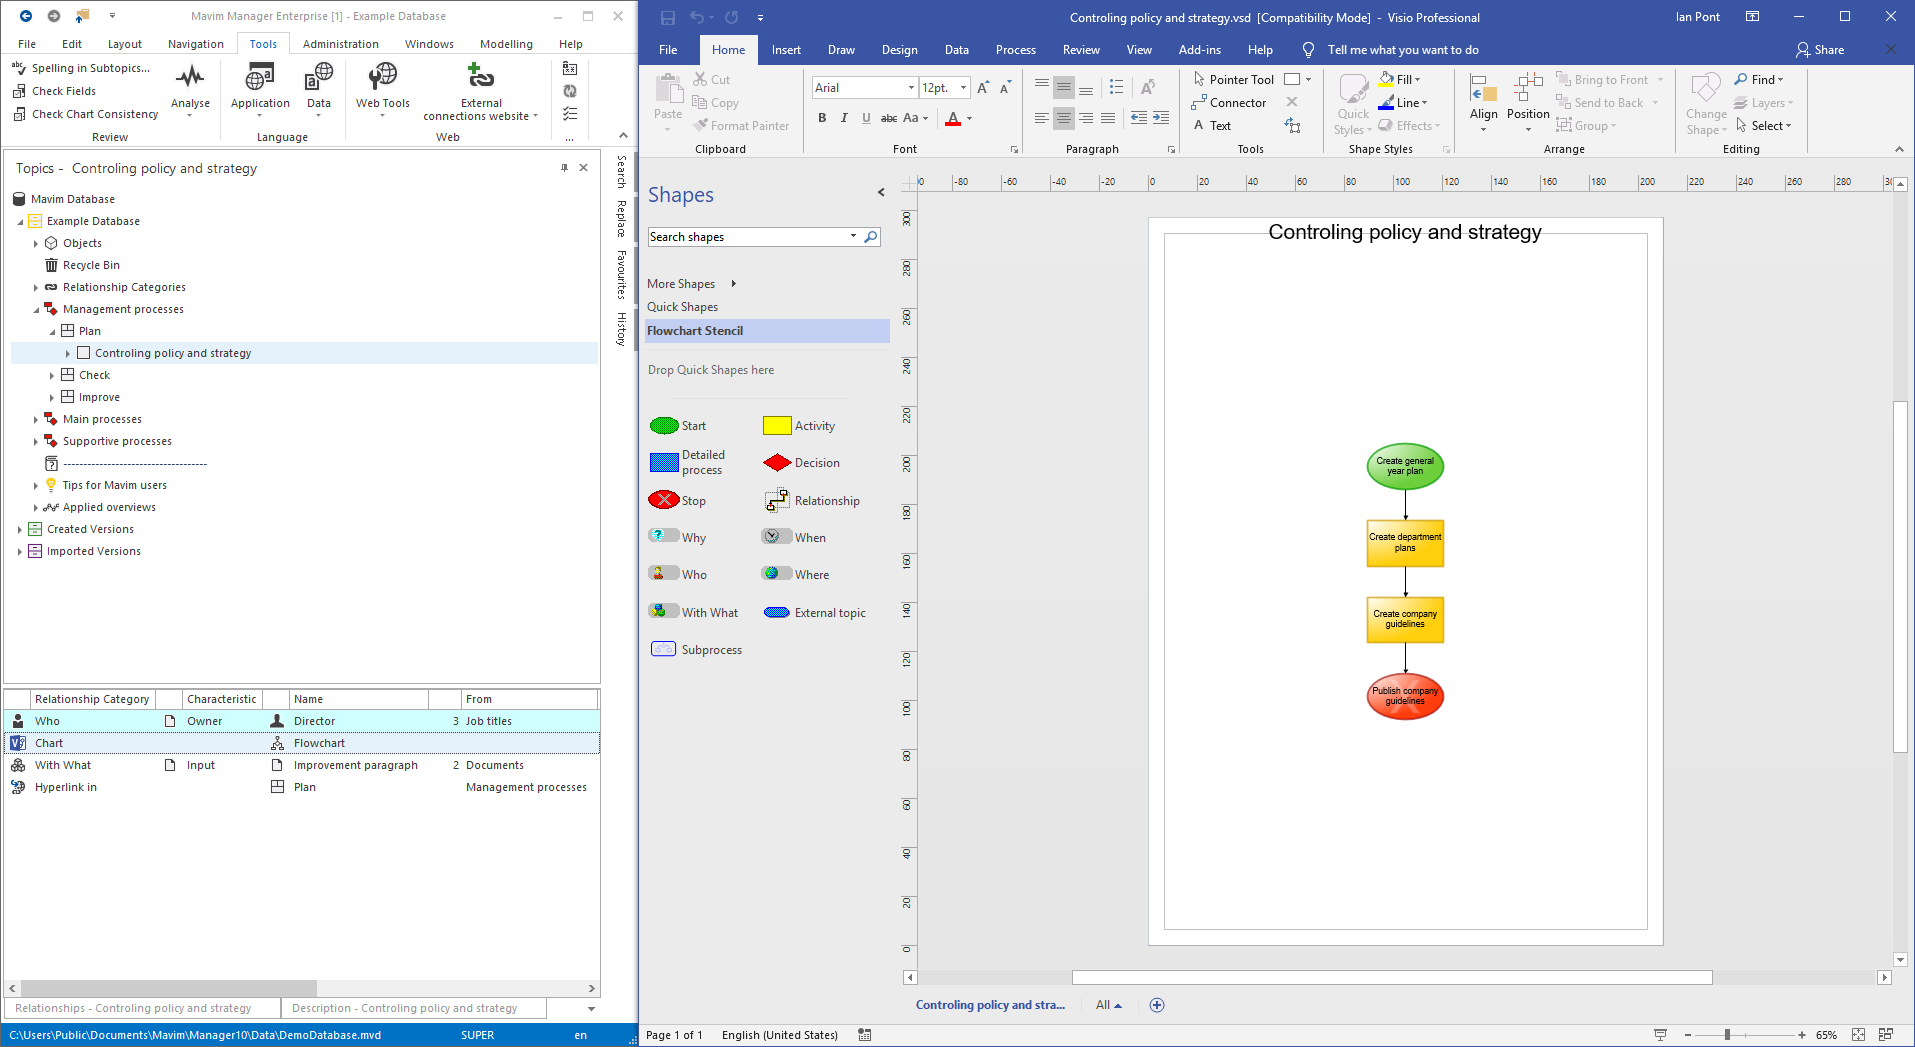
In Mavim you can present information from the database in the form of charts. You can also transfer information from charts to the Mavim database. For charts Mavim uses Microsoft Visio.
The following types of charts are supported by Mavim:
· Flowchart
· Hierarchical Chart
· Relationship Network Chart
· IDEF0 Chart
· Cross Function Flowchart
· EPC Chart
· Generic Chart
· ArchiMate
It is also possible to import existing Visio charts.
A number of functions are the same for all types of charts. See:
· Basic chart operations
· Common chart options
· Context menu
The functions that are specific to each chart type are explained for that chart type.
In Mavim charts are shown in the Relationship screen under the topic where the chart was created. They are shown as With What relationships. Charts can be opened from the Relationships screen by double-clicking the relationship.
Charts can also be included in a variety of publications, see Publication.
Note: To use the connection between Mavim and Visio you need to start Visio from within Mavim (i.e. not the separate Visio program).
For detailed instructions on how to use Microsoft Visio, see the documentation that comes with this software. Only the Visio functions that are relevant to the use of Mavim are included in Mavim help.
When Visio is started the Mavim screen is made smaller and the Visio screen is opened beside it: