1. Select the topic in the Topics screen that you want to generate a Flowchart for. The chart will consist of the topic and its direct subtopics.
2. Select the Edit tab followed by Overview > Flowchart.
A session of Visio is opened and the following screen is shown:
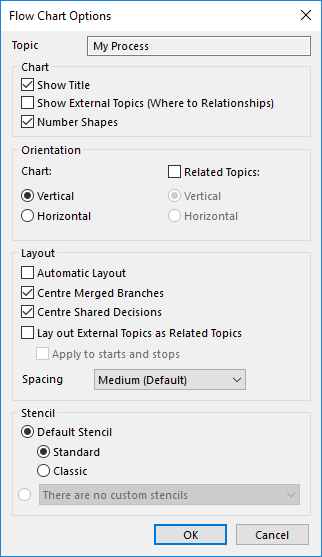
Show Title
If this option is chosen, the selected topic is shown as the title of the chart. This is not important for publication. Regardless of whether or not you have chosen this option, in a manual the topic name is printed as the title of the chapter section and on a website, it is always shown at the top of the description frame.
Show External Topics
Show/hide possible references from this process to other topics.
Number Shapes
If you choose this option, the text in the shape will include the order number of the topic
(see Topic Properties).
Orientation
Here you can select the orientation of the chart as Vertical or Horizontal as well as the orientation of the Related Topics.
Automatic Layout
By choosing this option, Mavim will automatically adjust the layout of the chart when topics are added or deleted.
Centre Merged Branches and Centre Shared Decisions
These options influence the way the automatic layout is applied.
Available Stencils
It is possible to modify the default stencils (see New Visio Stencil). You can use this option to select a modified stencil (when one has been created).
Click OK and the chart will be shown.
Note: You only have to create a chart once for each process. If you change parts of the process, they are automatically applied to the chart the next time it is opened in Visio.