The Options windows is available when creating a chart or by choosing Options from the context menu.
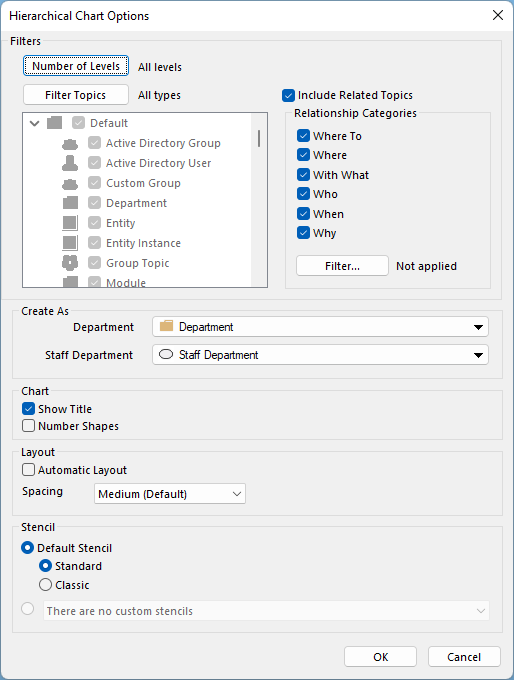
Number of Levels
You determine the number of levels you want to display in the chart. By default all levels will be displayed.
Filter Topics
Here you can select the topic types that will be displayed. By default, all topic types are included.
Include Related Topics
If you choose this option, the selected relationship categories will be shown in the hierarchical chart. This is determined by relationship category. Filtering of the related topics can also go a step further:

If the text "Not applied" is shown next to the filter button, then no additional filters have been configured for this chart.
Filtering Related Topics
If you would like to filter which topic types or even which icon a topic is used for related topics, click the Filter button in the Relationship Categories section:
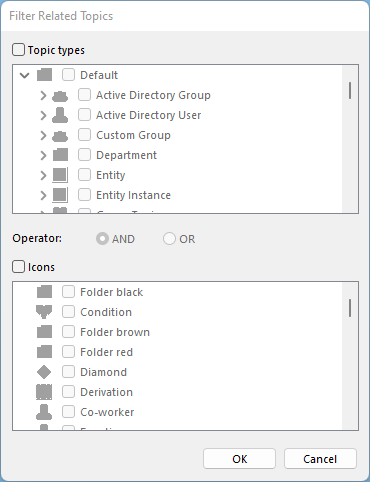
If you enable the checkbox next to Topic types, the section under it will become available and you will be able to select which topic types are to be shown in the chart as related topics.
This filter can go even further in that you are also able to include a filter on specific icons:
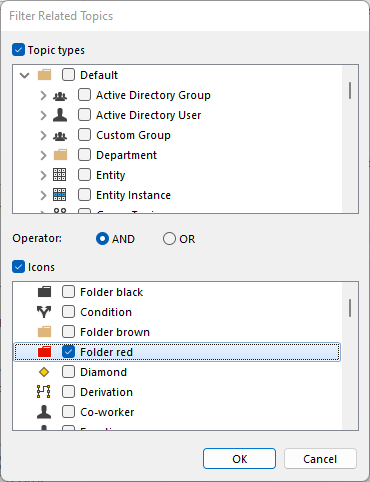
Notice that you can choose the operator to use, AND or OR. Using AND will mean that both the Topic Type(s) you have selected and the Icon(s) you have selected must match in order for the related topic to show up on the chart. Using OR will mean that either the Topic Type(s) you have selected or the Icon(s) you have selected will need to match for the related topic to show up on the chart.
Important note: The filter you configure for a chart will be kept for that chart. However, the last filter saved will also be the selected filter for any new chart created after closing the previous chart.
Create As
Here you can select the topic type for two topics: Department and Staff Department. If you generate this chart in Visio, these new departments (of the type that you have set here) will be created in Mavim.