Cross Function Flowcharts are created somewhat differently to other chart types. It is similar to creating a matrix (see Matrix for more information) in that you must first create a Cross Function Flowchart Definition.
A Cross Function Flowchart is created as follows:
1. Select a topic for which you want to generate a cross function flowchart in the Topics screen.
2. Go to the Edit tab and select Cross Function Flowchart from the Overview group.
The Cross Function Flowchart Definition window is shown:
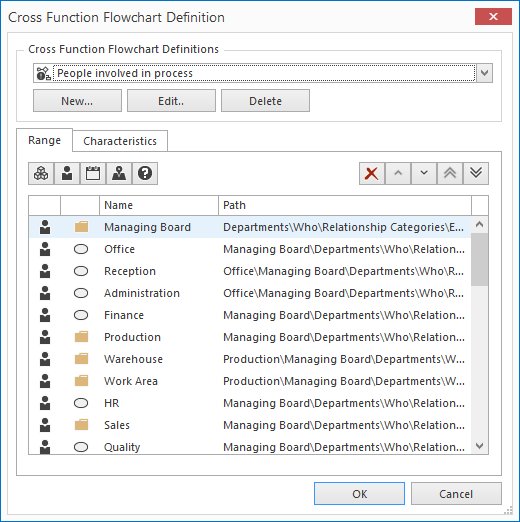
This window consists of the following parts:
Cross function flowchart definitions:
In the cross function flowchart definition, you define which lanes and which characteristics will be shown in the chart. This definition can be used for multiple flowcharts, so it is advisable to give each definition a unique name.
· New: a new window is opened in which you can enter the name of the new definition.
Then click OK.
· Edit: edit an existing definition.
· Delete: delete an existing definition.
Range tab:
Click the relationship category buttons  to add the topic(s) that will function as the chart lanes.
Note: If you would like to use a Cross Functional chart definition multiple times it is advised to select a range that has extra room. This may produce empty lanes in the chart but it is very simple to hide empty lanes in the chart. See Show/Hide Empty Swim Lanes
Characteristics tab:
For every relationship category that was selected in the range definition, characteristics can be defined. Only do this if you want to limit the number of characteristics in a chart. If you do not define characteristics, all will be shown.

Click the button with the cross to delete a topic or characteristic. The buttons with the arrows can be used to change the order of the topics and characteristics.
3. Click OK to generate the chart. The Cross Function Flow Chart Options window is opened (for an explanation see further down in this help topic).
Note: The definition window resembles the window for the matrix. However, there are differences:
· In a matrix definition, when a topic is added to the range (a column is added to the matrix for that topic) all its subtopics are also included, e.g. when the topic "employees" is added, there will be a column for "employees" and all employees. This is not true for the cross function flowchart: only the selected topics are given a lane.
· In the matrix, while editing the matrix, you can return to the matrix definition and edit it. For cross function flow charts, this is not the case. The definition can be
changed, but another window is used
4. After you have created a definition for the swimlanes and characteristics, the Cross Function Flowchart Options window appears, in which you can set a number of options. These options can also be changed during the editing of the chart.
The window consists of the following parts:
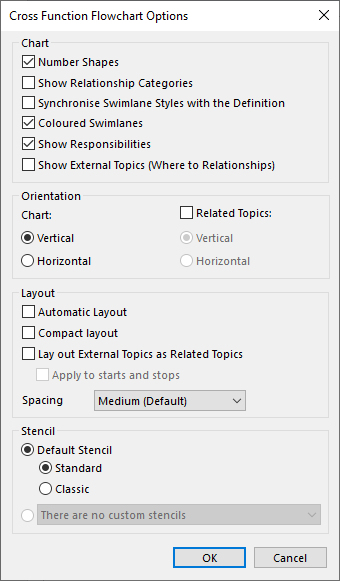
Show Relationship Categories:
If this option is enabled, the relationship category of the swimlane is shown.
Coloured Swimlanes:
If this option is enabled, the application will give each lane a different colour. You can change the colour of each lane later on if you wish.
Show External Topics:
You can select whether or not you want to include external topics.
Orientation:
Here you can select whether you want the chart to be displayed Vertically or Horizontally.
5. Click OK: the chart is shown.